(第2回)Rを使ったグラフィック -ggplot2-
Rのグラフィック第2弾
さて、前回の記事(第1回)Rを使ったグラフィック -ggplot2- - Data Science by R and Pythonから、時間が少しかかりましたが、ggplot2を持ちいたグラフィックの第2弾を紹介します。
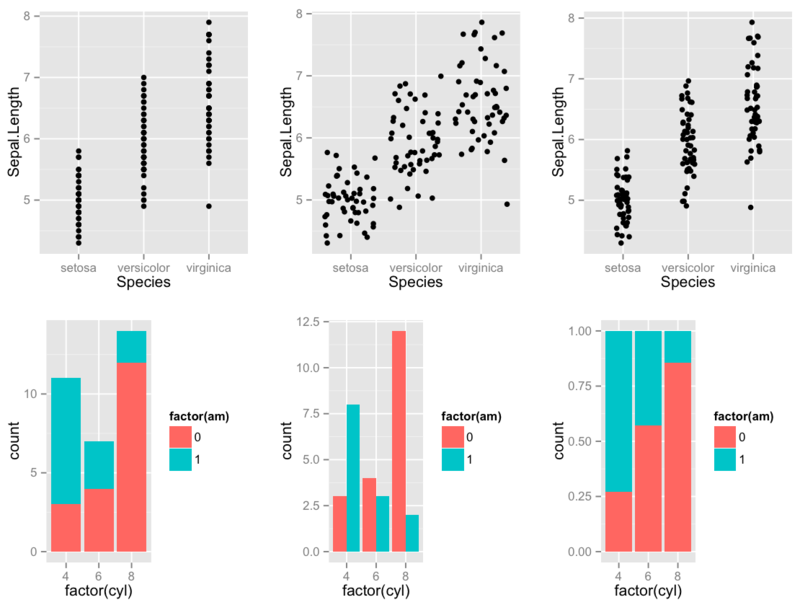
描画要素の配置の指定を行う。
ここで、指定するのは"position"という引数です。これを与えることで表示を変更することができます。特に、有効なのは「棒グラフ」の場合です。積み上げ型の図を書きたい場合もあれば、並べて表示したい場合もありますし、更に「全体を100」にして割合で表示したい場合もあります。こういうのをRの通常のプロットを使ってやるのはなかなか面倒なのですが、ggplot2なら楽々できてしまいます。具体的なコマンドは次の通りです。
setwd("~/Desktop/blog/ggplot2")

#library
library(ggplot2)
library(gridExtra)

#position
p1=ggplot(data=iris,aes(x=Species,y=Sepal.Length))+geom_point()
p2=ggplot(data=iris,aes(x=Species,y=Sepal.Length))+geom_point(position="jitter")
p3=ggplot(data=iris,aes(x=Species,y=Sepal.Length))+geom_point(position=position_jitter(width=0.1))
#とりあえず、barで書いてみると...
p4=ggplot(mtcars,aes(x=factor(cyl),fill=factor(am)))+geom_bar()
#2つを並べて表示したい場合
p5=ggplot(mtcars,aes(x=factor(cyl),fill=factor(am)))+geom_bar(position="dodge")
grid.arrange(p1,p2,p3,p4,p5,nrow=2)
#positionにもいろいろあります
p6=ggplot(mtcars,aes(x=factor(cyl),fill=factor(am)))+geom_bar(position="fill")
grid.arrange(p1,p2,p3,p4,p5,nrow=2)
視覚的なプロットの色と軸のスケール
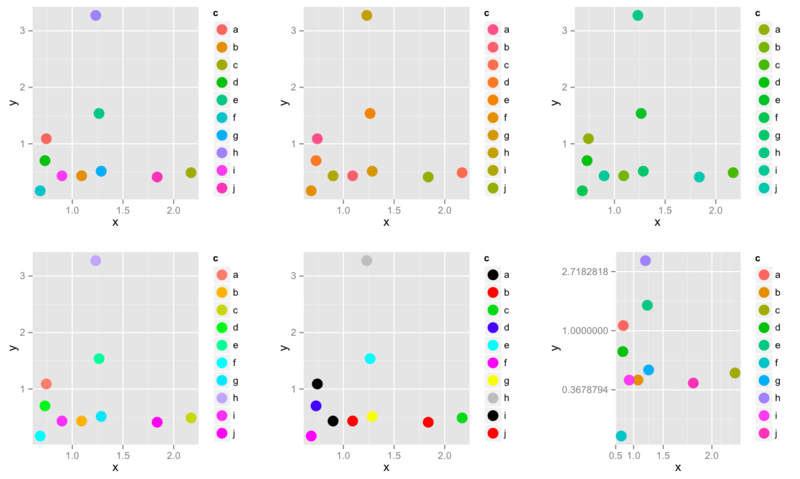
ggplot2の特徴の1つは、データの値と、視覚要素の値を「スケール」という概念で対応づけています。スケールは、レイヤーの属性ではなく、グラフの属性であることに注意が必要です。scale_関数を用いれば随分と柔軟に色も軸も変化させることができます。実際に見ていくと...
#scale
dd = data.frame(x=rexp(10,1),y=rexp(10,0.5),c=letters[1:10])

#scale color hue:色の色相のスケールということで、使う色を変化させる関数
#normal plot(普通のggplot2)
p1=ggplot(data=dd,aes(x=x,y=y,colour=c))+geom_point(size=5)+scale_colour_hue()

#scale limit(色相を限定したggplot)
p2=ggplot(data=dd,aes(x=x,y=y,colour=c))+geom_point(size=5)+scale_colour_hue(h=c(0,90))

#色相は0-90:赤、90-180:緑,180-270:青,270-360:紫
p3=ggplot(data=dd,aes(x=x,y=y,colour=c))+geom_point(size=5)+scale_colour_hue(h=c(90,180))

#明るさ・鮮やかさ(luminosity and chroma)
p4=ggplot(data=dd,aes(x=x,y=y,colour=c))+geom_point(size=5)+scale_colour_hue(l=80,c=150)

#色をマニュアルで指定することもできる。(valueの引数にredとか入れればok)
p5=ggplot(data=dd,aes(x=x,y=y,colour=c))+geom_point(size=5)+scale_colour_manual(values=c(1:10))

#x軸, y軸のスケールを変更log, expなど, log transはマイナスが存在するとできない...
p6=ggplot(data=dd,aes(x=x,y=y,colour=c))+geom_point(size=5)+scale_x_continuous(trans=scales::exp_trans())+scale_y_continuous(trans=scales::log_trans())

#plot
grid.arrange(p1,p2,p3,p4,p5,p6,nrow=2)
ちょっと注意
ggplot2では、スケールがレイヤー属性ではなく、グラフの属性なので、スケールに関しては、1つのグラフは1つの視覚的要素に対して、1つのスケールを持つということが大前提です。そのため、スケールの異なるグラフを「2軸」でプロットすることはできません。一応ポリシーに基づく仕様らしいですが...でも、書きたいときもあるじゃないですか...
ファセットの指定
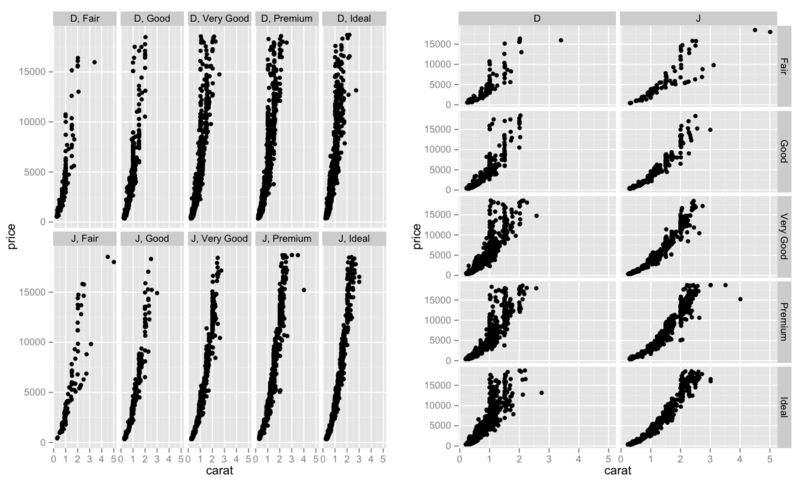
1つのグラフは、データ、マッピング、スケールなどを共有する複数のパネルを持つことができます。この機能は「ファセット」と呼ばれます。簡単に言えば「ある変数について、異なる水準のデータを別々のプロットにして描画したい」というときに使います。ファセットには2種類あり、単純に並べる「facet_wrap」とグリッド的に並べる「facet_grid」があります。両方見てみましょう。
#facet
#diamonds is in ggplot2 package
diamonds2 = diamonds[(diamonds$color=="D")|(diamonds$color=="J"),]

#cut,colorを水準毎に並べて表示
p1=ggplot(data=diamonds2,aes(carat,price))+geom_point()+facet_wrap(~color+cut,nrow=2)

#cut,colorを水準毎に表示する別の例
p2=ggplot(data=diamonds2,aes(carat,price))+geom_point()+facet_grid(cut~color)

grid.arrange(p1,p2)
グラフの座標を変更したい
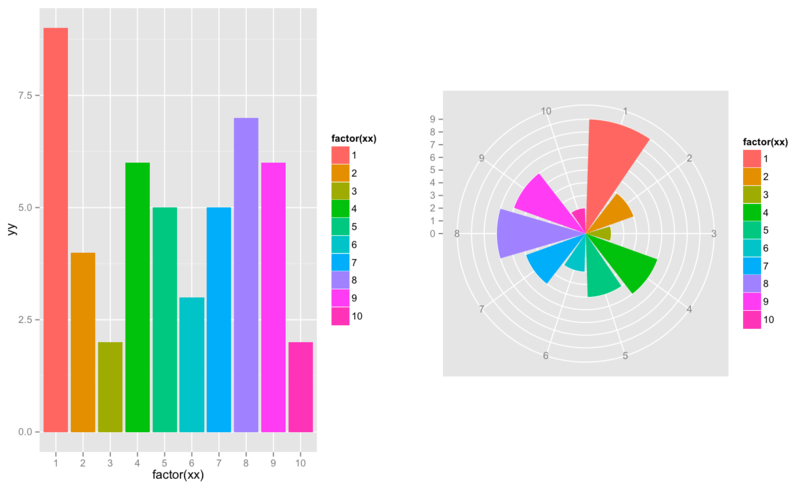
さて、グラフがあるときにそれを「パイチャート」:円グラフにしたいという場合があります。これも、実は簡単にできます。。。いや、簡単なのかはさておき、奇麗につくれます。
#coord polar:座標系変更
set.seed(9876)
dat=data.frame(xx=1:10,yy=sample(10,replace=T))

p1=ggplot(data=dat,aes(factor(xx),yy,fill=factor(xx)))+geom_bar(stat="identity")

p2=ggplot(data=dat,aes(factor(xx),yy,fill=factor(xx)))+geom_bar(stat="identity")+scale_y_continuous(breaks = 0:10) +coord_polar() + labs(x = "", y = "")

grid.arrange(p1,p2,nrow=1)
グラフの外観
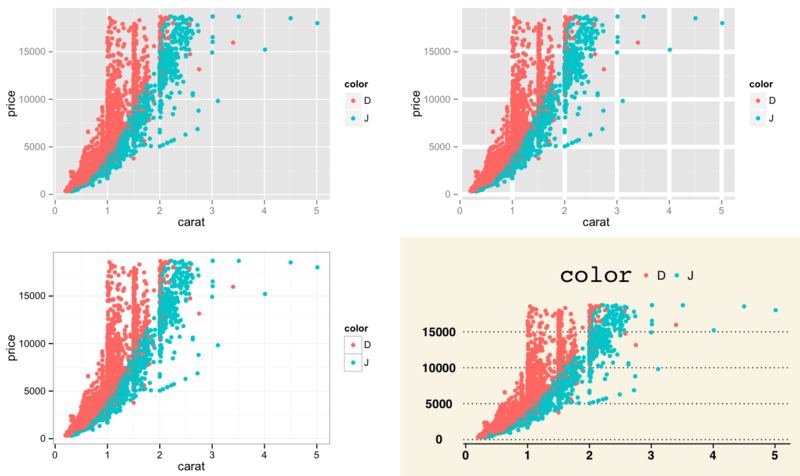
最後に、グラフの外観なんかも帰れたりします。「theme」という関数があって、それで変更します。また、”ggthemes”というパッケージでは、いろいろテーマがあるので探してみてください。
#normal
p1=ggplot(diamonds2,aes(carat,price,colour=color))+geom_point()
#bold grid
p2=ggplot(diamonds2,aes(carat,price,colour=color))+geom_point()+theme(panel.grid=element_line(size=2))
#white-black theme
p3=ggplot(diamonds2,aes(carat,price,colour=color))+geom_point()+theme_bw()
#use ggtheme
library(ggthemes)
p4=ggplot(diamonds2,aes(carat,price,colour=color))+geom_point()+theme_wsj()
grid.arrange(p1,p2,p3,p4,nrow=2)
まとめ
ここまでで、たくさんggplot2のことをみてきましたが、使い始めて実感するのはとにかく便利過ぎるということ。これ使い始めると、plotに戻れなくなります。特に「表現力」という視点からすると、ggplotはplotを遥かにしのいでいる気もします。ただ、2軸プロットができないのだけは、困りものなんですが。次回からは、ggplotいろんな場面での使用法をはじめ、実際にggplotでいろんなものを表現してみたいと思います。それではここまでです。